Enviado para você por Rui Moio através do Google Reader:
What statistics do you monitor in Google Analytics?
I've written before on some of the statistics that I monitor on my blogs but one that I didn't include is to look at the traffic coming in from Search Engines over time.
Here's one of my favorite ways to get a quick overview of whether my blog is on the rise or not with regards to traffic from Search Engines.
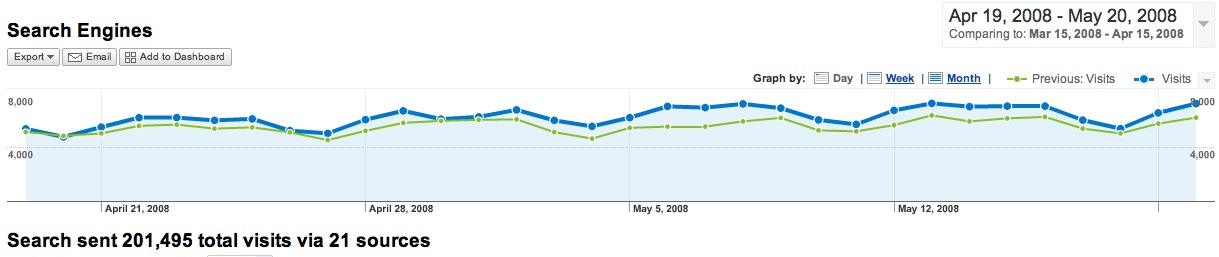
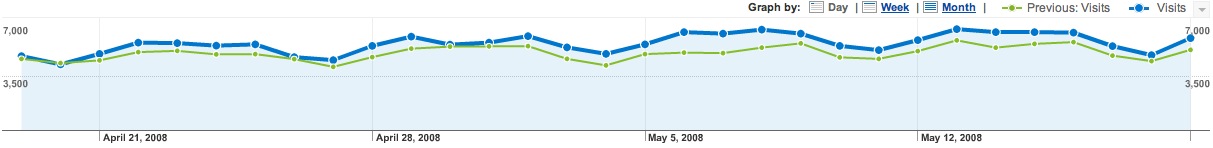
The above graph (click to enlarge) is generated in Google Analytics and compares traffic from search engines to Digital Photography School (just the blog, not the forum) over the last two months.
The last 30 day period is the blue line and the month before that is the green line.
This graph immediately tells me that traffic is up from search engines over the last month.
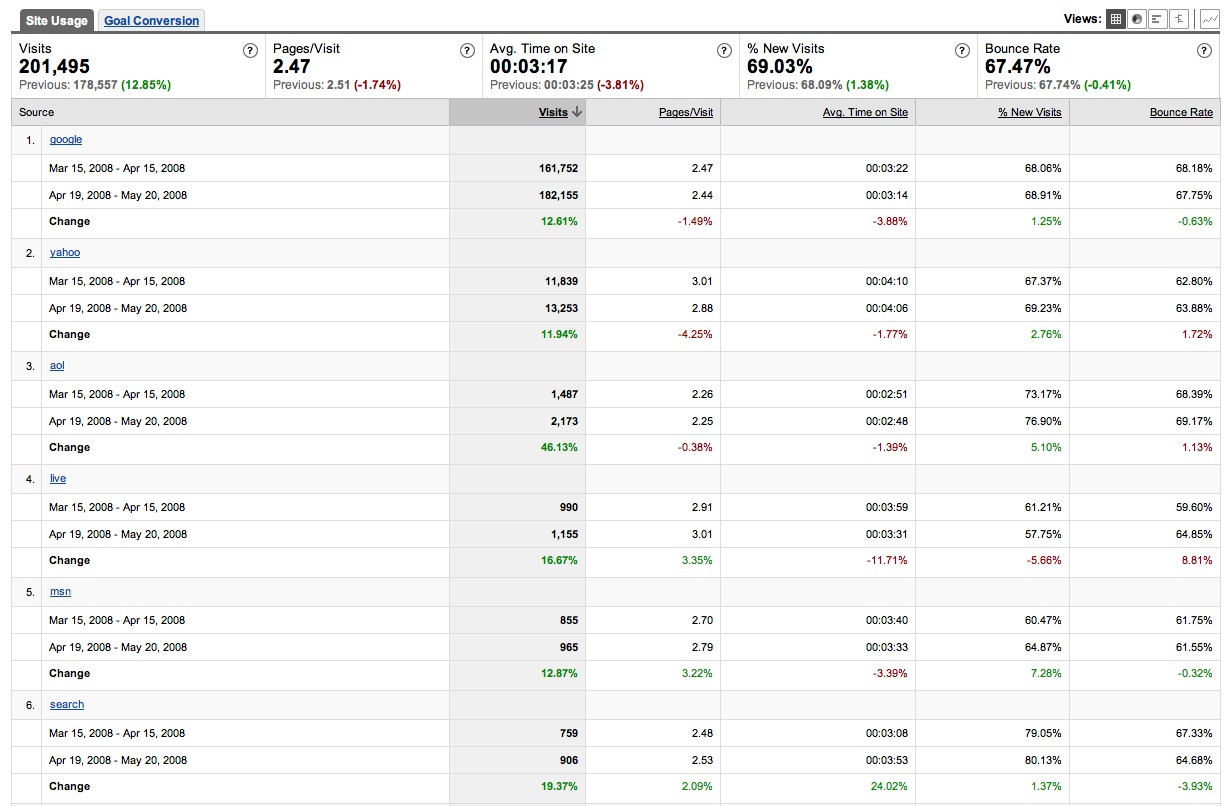
The screen shot above (click to enlarge) shows that Search Engine traffic is up by 12.85% and also highlights where the rises in traffic have come from over the two periods (as well as other information between the two periods like the bounce rate, average time on site, pages visited per visitor etc).
How do you get this graph and information?
Here's a quick step by step process (to do this you need to have run Google Analytics for at least two months).
1. Log into your Google Analytics account
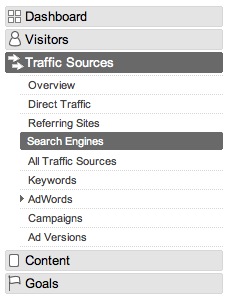
2. In the left hand menu click 'Traffic Sources'
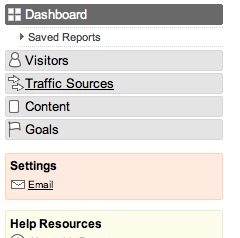
3. Then select 'Search Engines' in the sub menu that opens up
4. This will open up the last month of your Search Engine traffic with a graph.
5. On the right hand side of your screen and towards the top you'll see the date range of the last month. Click this open to get to this screen.
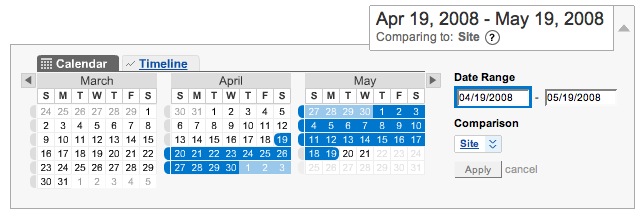
6. In that box you'll see a 'Comparison' drop down menu. Click on the 'Date Range' option.
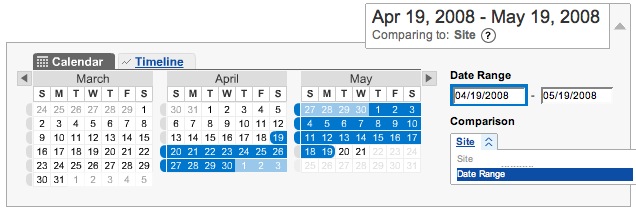
7. You can leave the blue date range as is - but with the 2nd date range (green) select the dates you want to compare. Then click 'Apply'.
Note: I always choose dates that correspond to the days of the week chosen in the 1st (blue) date range. If the blue date range starts on a Sunday and ends on a Monday make the green range start on Sunday and end on Monday too.
While this leaves a few days not charted in between the date ranges it means that you're comparing days of the week with the same days of the week in the two months. This makes it easier to see the comparison as the graph will usually rise and fall in the same pattern.

You now can see how the two month's compare. This is where my analysis often stops as it gives me a snapshot view of how things are going. But from this point there are any number of ways to drill down further including:
Drilling Down Further
You can drill down further to see a graph for each search engine by scrolling down the page a little and clicking on one of the links of the search engine you want to compare over the two months.
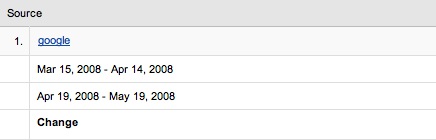
This will take you to a page where you can see just the comparison in what traffic Google, or Yahoo might have brought. For example clicking on the Google stats takes me to a graph like this (similar to the above one as Google is my major source of SE traffic):
Once on this page there's more interesting insights to be had as they allow you to see your top keywords. For example I can see the comparison for the search term 'DSLR' for the two months which has seen a 17.03% increase in traffic as a result of people searching for that term.
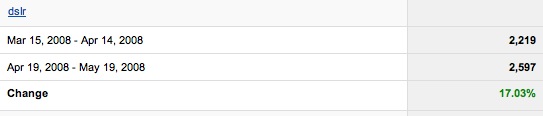
If I click on the 'dslr' link I can even see a graph of the two months again and the traffic for each day of the week for that particular keyword.

This is useful if you've been optimizing a particular word or just simply to analyze one search result might have been having a significant shift. I now have some hints on a keyword that I might want to optimize a little better now.
There are literally hundreds of threads of statistics that Google Analytics can provide you with. This is just one of my favorites. How do you use it to provide you with interesting and more importantly useful information on your blog and how it's going?
PS: Here's another fun comparison for those of you who have been using Google Analytics for a longer period of time. Use the same process outlined above to compare longer periods of traffic. For example - here's my overall traffic at DPS from the first five months of this year as compared to the first five months of last year:
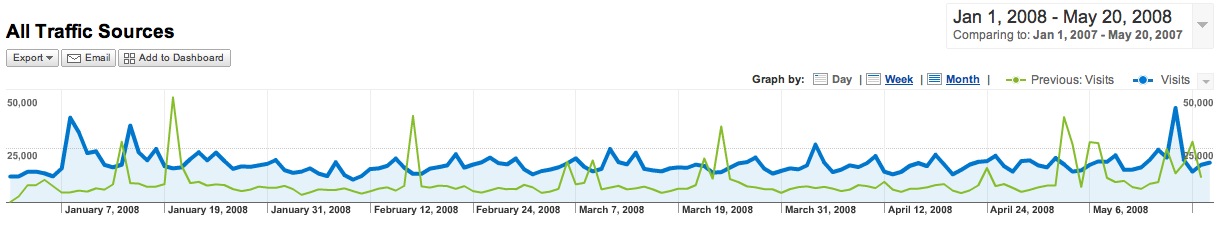
There might not be a lot to glean from this graph - but it sure is motivating to look where you've come from - it's a 94% increase. Something to motivate me for the next 12 months!
Coisas que você pode fazer a partir daqui:
- Inscrever-se no ProBlogger Blog Tips usando o Google Reader
- Comece a usar o Google Reader para manter-se facilmente atualizado com todos os seus sites favoritos


Sem comentários:
Enviar um comentário